
 McCann, M., 2019. Restoring oysters to urban waters: lessons learned and future opportunities in NY/NJ Harbor. The Nature Conservancy, New York, NY, 65pp. see PDF and link
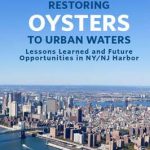
Before New York City was The Big Apple, it was The Big Oyster. Report tells the story of the eastern oyster, Crassostrea virginica in one of the most heavily urbanized estuaries in the world. Waters have been the subject of over 20 years of research and restoration, including an upcoming scaling-up of efforts in the near future. This assesses past efforts, and synthesizes lessons learned and challenges ahead.
CHNEP Volunteer Oyster Habitat Monitoring Program’s Volunteer Coordinator Manual
CHNEP, 2017. Volunteer Oyster Habitat Monitoring Program, Charlotte Harbor National Estuary Program, 38pp.
Includes information on volunteering, and Standard Operating Procedures (SOPs), Charlotte Harbor National Estuary Program (1/17).
See link or pdf
Australia’s Bivalve Habitats: Their Repair & Conservation
 Gillies, C.L., C. Creighton, and I.M. McLeod, Eds., 2015. Shellfish reef habitats: a synopsis to underpin the repair and conservation of Australia’s environmentally, socially and economically important bays and estuaries. Report to the National Environmental Science Programme, Marine Biodiversity Hub. Centre for Tropical Water and Aquatic Ecosystem Research (TropWATER) Publication, James Cook University, Townsville, 68pp.
See link or PDF.
Australian Shellfish Ecosystems
Gillies, C.L., I.M. McLeod, H.K. Alleway, P. Cook, C. Crawford, C. Creighton, B. Diggles, J. Ford, P. Hamer, G. Heller-Wagner, E. Lebrault, A. Le Port, K. Russell, M. Sheaves, and B. Warnock, 2018. Australian shellfish ecosystems: past distribution, current status and future direction. PLoS ONE 13(2):e0190914. link or PDF
Leonard, D. and S. Macfarlane, 2011. Best management practices for shellfish restoration. Prepared for the ISSC Shellfish Restoration Committee, 42pp. plus appendices.
 Peter-Contesse, T., with B. Peabody, 2005. Reestablishing Olympia oyster populations in Puget Sound, Washington. Washington Sea Grant Publication WSG-AS 05-04. 9pp
zu Ermgassen, P.S.E., B. Hancock, B. DeAngelis, J. Greene, E. Schuster, M. Spalding, and R. Brumbaugh, 2016b. Setting objectives for oyster habitat restoration using ecosystem services: a manager’s. TNC, Arlington VA. 76pp (see link or PDF).
The document Setting Objectives for Oyster Habitat Restoration Using Ecosystem Services, A Manager’s Guide explains the science behind the calculator, and provides examples and case studies and goes hand in hand with the calculator to estimate both bay wide Oyster Filtration and Fish Production (see http://oceanwealth.org/tools/oyster-calculator/) for US estuaries only.
Rate of filtration: is density required to achieve full estuary filtration within the residence time. It is calculated by dividing the bay volume by the residence time and converting the output to litres per hour.
Historic Filtration: A reference value of the filtration that would have been provided by the historic oyster habitat where that historic condition of oysters is known (zu Ermgassen et al. 2013). Historic filtration is not used in calculating current day filtration or restoration goals and is only a historical reference.
Current Filtration: The estimate of the current filtration based on the Current Oyster Properties data provided. It is displayed as percent filtration of the Estuary Filter Volume in litres per hour.
Goal Filtration: The Estuary Filtration Percent (under Goals) displayed in litres per hour.
Fish production data are from zu Ermgassen et al. 2015. (see PDF or link). Estimates are regional estimates of production, and thus do not account for variability that is inherent within individual sites. However, estimates of production can be improved for a particular bay or estuary by using the Est. Site Abundance feature to adjust for relative abundance for your particular bay/estuary. Estimates are only available for the Northern Gulf of Mexico and part of the Atlantic coasts (Floridian, Carolinian and Virginian ecoregions).
Est. Site Abundance: Select the estimated site abundance (ind./ha) for the bay or estuary you are calculating for. Default is mean abundance for either the Gulf of Mexico or Atlantic coast (where applicable). High abundance is mean +1 SD. If species is not present, or occurs in low abundance, select ‘None’.
# New Individuals: Calculated by multiplying site abundance by acres of restored habitat required to meet filtration goal.
New Biomass: The per species biomass, per year. Calculated by multiplying site abundance by acres of restored habitat required to meet filtration goal by biomass for each species per ha.
Note: Fish production data are only available for the Northern Gulf of Mexico, Floridian, Carolinian, and Virginian ecoregions.
FL Oyster Condition Assessment Protocol (34pp.)
Developed by L. Walters (UCF), R. Brockmeyer & E. Hernandez (St. Johns RWMD), N. Dix (GTM NERR), A.S. Noel, NEFLAP, among others. The goal of this document (revised 3/28/16) was to assess and monitor intertidal oyster reefs using a standardized protocol. The document provides a step-by-step protocol to use on to monitor reefs. Data sheet examples are also provided.
Common Ground: Saving the Chesapeake’s Oysters (CBF video)
CBF’s video on history of the oyster in Chesapeake Bay (see https://www.youtube.com/watch?v=p4eLoDbdoEQ)
Won Cine Golden Eagle Award (1999)
Also CBF’s oyster link (http://www.cbf.org/oysters)
 Leung, V.A., N. Woiwode, and M.P. Smith, 2018. A procurement guide to nature-based solutions. January 2018, TNC, 26pp. PDF
The guide provides a great “how to” for writing RFPs that include nature-based/green infrastructure approaches for stormwater and flood hazard projects.